
WhoDB for data analysts
Use WhoDB to inspect source records, build an analysis query, and deliver a result whose meaning you can explain. The key step is defining the metric before choosing the query.
Decide what the report counts#
Write down the population, time interval, grouping, and treatment of missing values. For an order report, decide whether cancelled orders count and whether the date refers to creation, payment, or fulfilment.
Inspect the relevant fields in Info and read a small sample in Data. Use Graph to check declared relationships before joining. A table name that sounds right is only a starting point; the records and application definitions establish what it means.
Build from records to totals#
Start with a sample query in Scratchpad. Add a join in another cell, check its row count, and only then add the aggregate. A one-to-many join can repeat the same parent record, so counting joined rows can overstate a customer or order total.
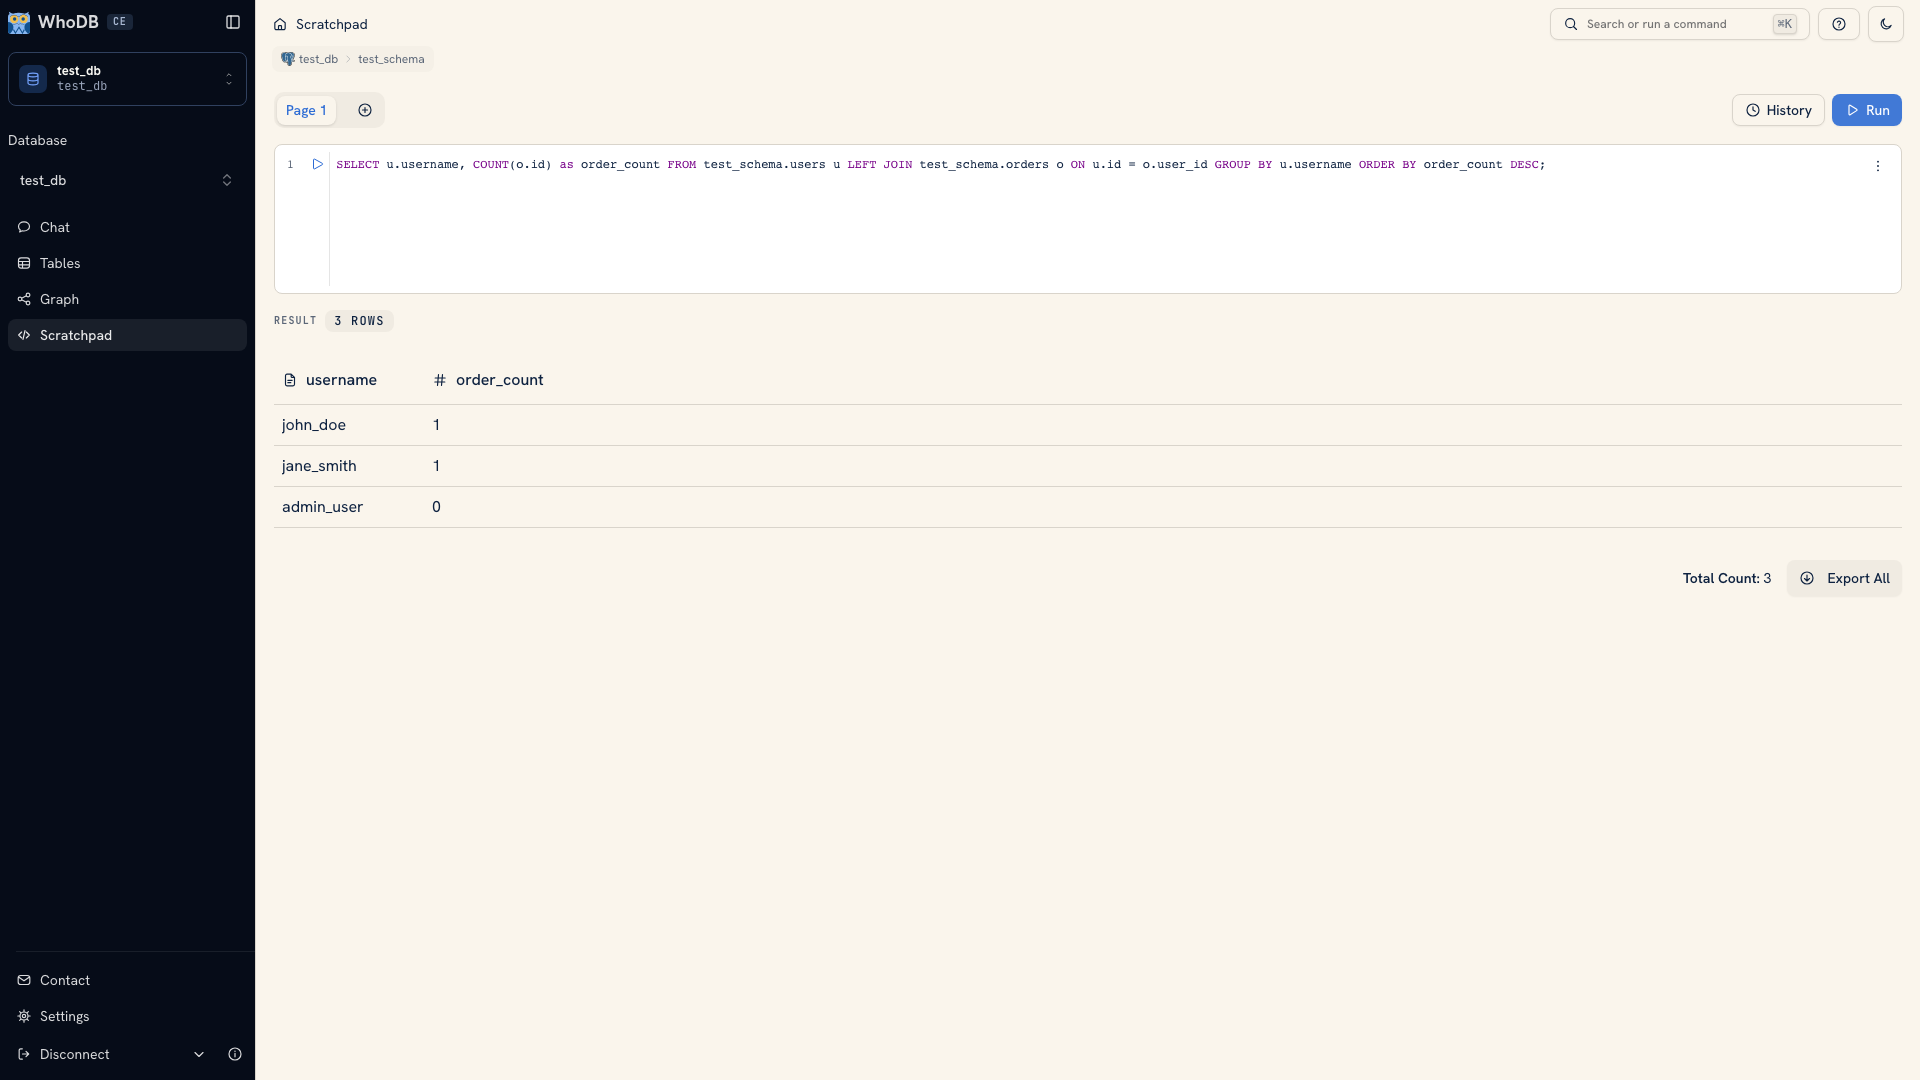 A query combining related data
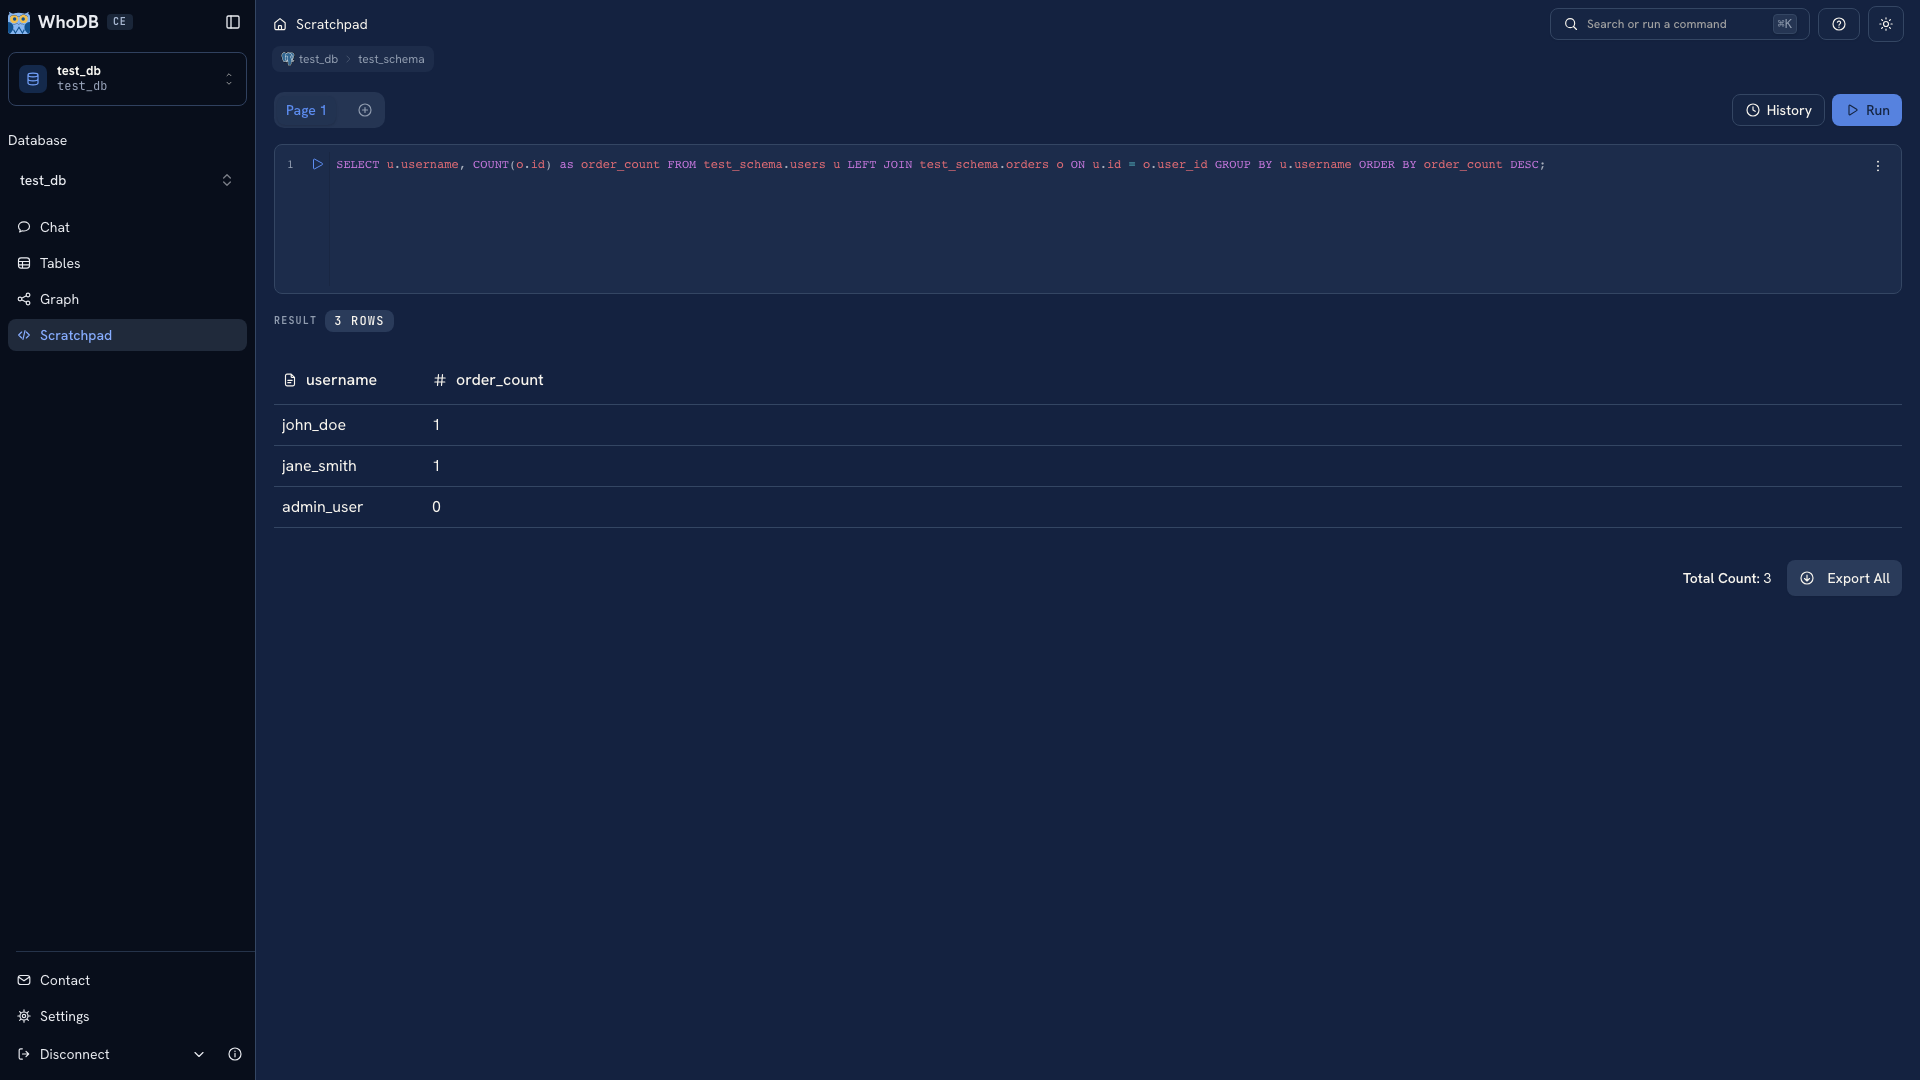 A query combining related data
Compare the aggregate with a few known cases, including a missing value and a record with several related rows. Build a query one step at a time walks through this process.
Chat can help draft SQL, but inspect the generated fields, predicates, and joins before using the result in a report.
Deliver the answer with its context#
Export the query result as CSV or Excel. Keep the SQL, metric definition, source environment, and extraction date with the file. Use a query result for a filtered report because whole-object exports do not inherit the Data view's filters.
If the analysis becomes a repeated preparation task, consider Transforms in WhoDB Platform. Keep your verified CE query as a reference for checking the pipeline's output.
Was this page helpful?