
Explore relationships in Graph
Use Graph when you need to understand how objects connect before writing a join or investigating a record. A diagram can make an unfamiliar schema easier to follow than opening tables one at a time.
Open Graph from the sidebar when the source exposes graph relationships. The canvas is based on source metadata.
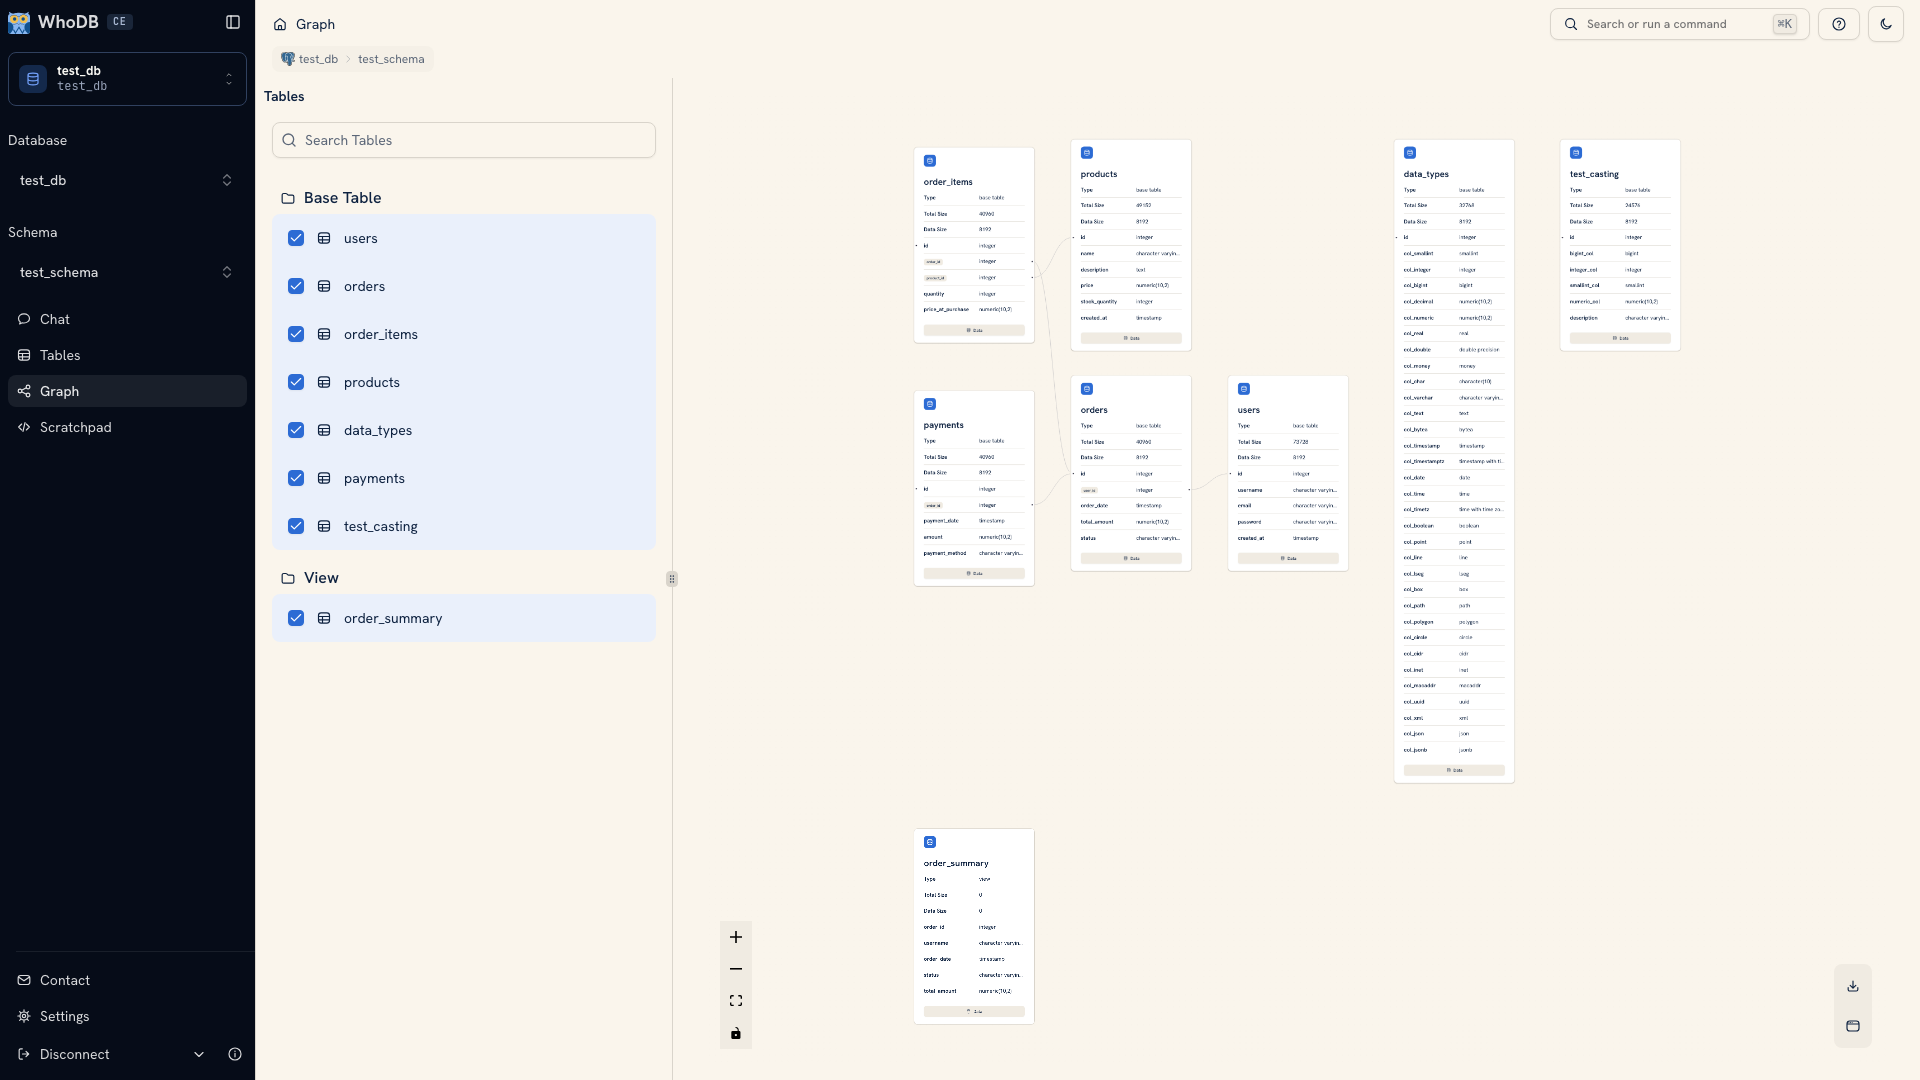 The schema graph with connected objects
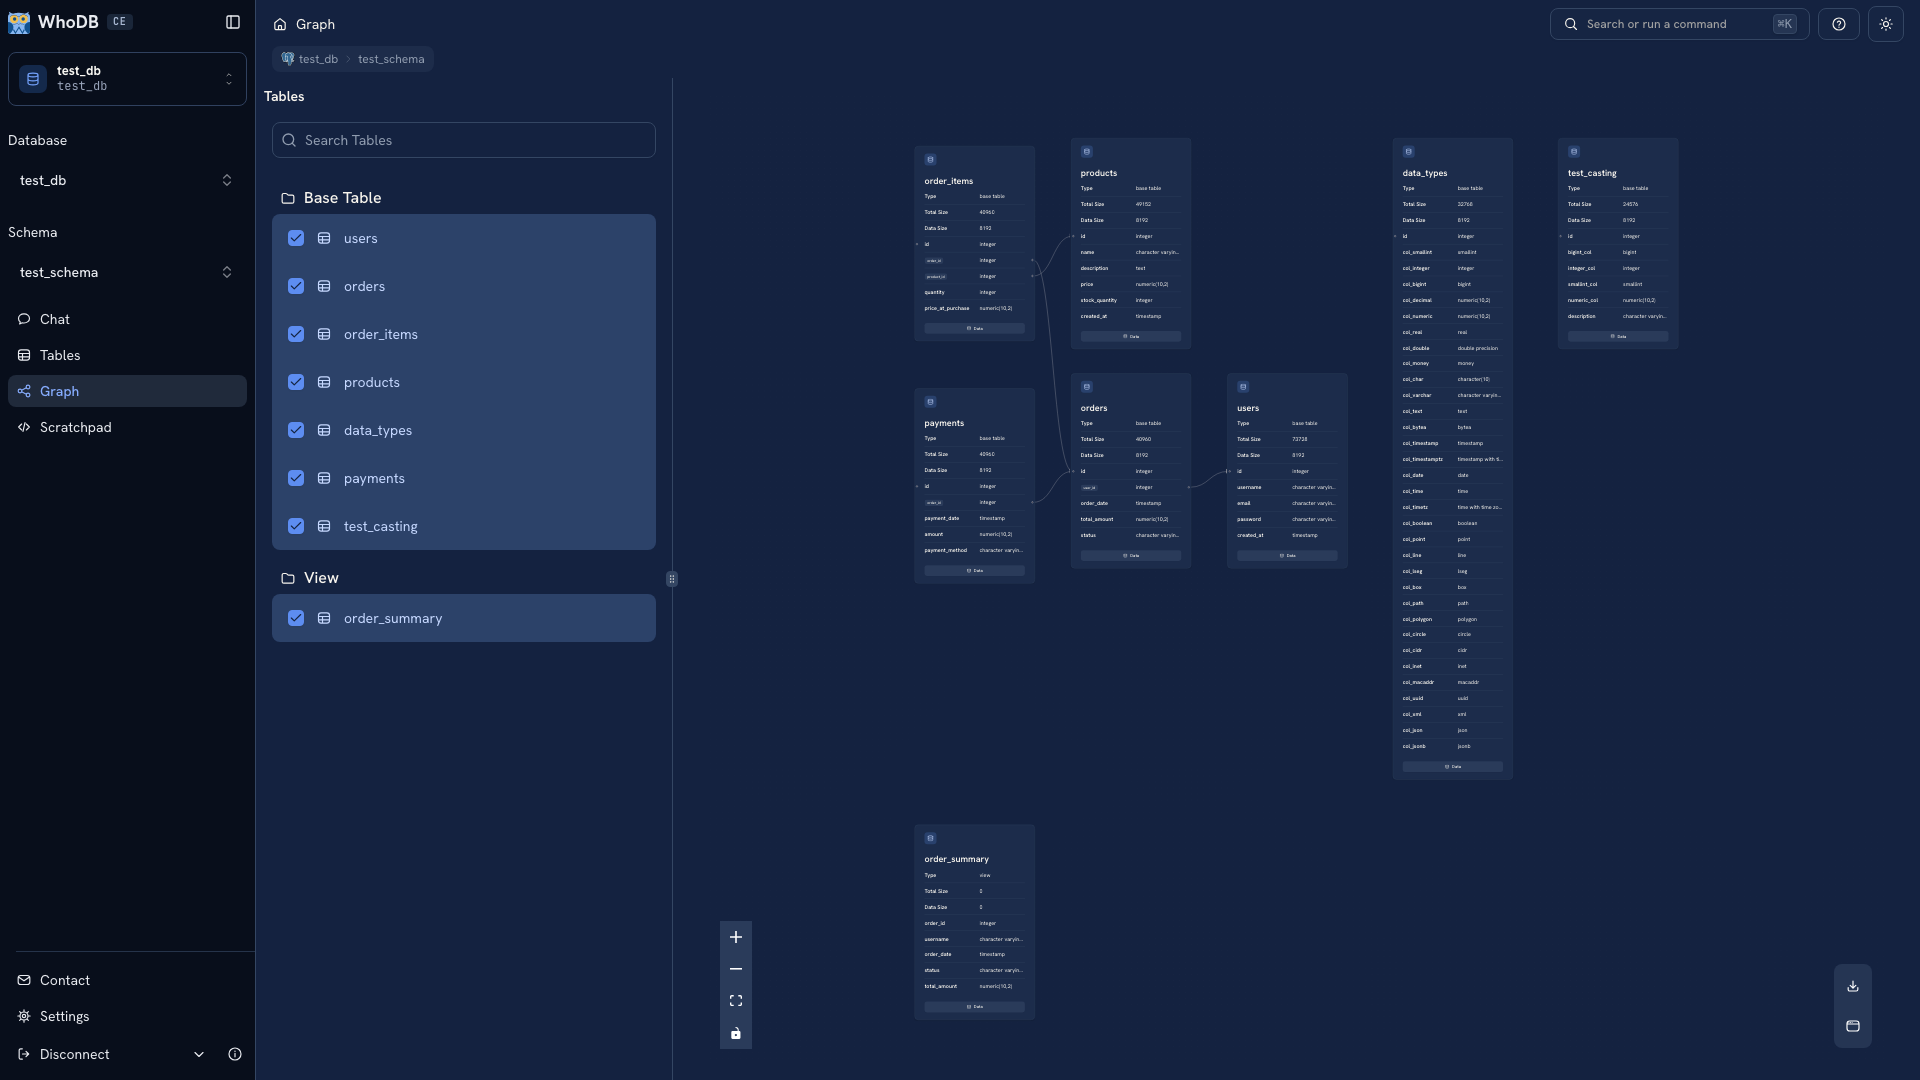 The schema graph with connected objects
Build the view#
Search the secondary list for the objects involved in your question and select their checkboxes. Nodes represent objects, and edges represent the relationships reported by the source.
Start with a small set. For an order investigation, choose orders, users, and order items before adding less relevant objects. Selecting the entire schema can make the important path difficult to see.
Consecutive selected objects share a highlighted group in the list. A gap in the selection starts a separate group. On a small screen, use Browse items to change the selection, then View content to return to the canvas.
Inspect a node#
Click a node to load its field details where needed. Inspect the keys and column names on both sides of a relationship. Use the node's Data action when you want to read the object's records.
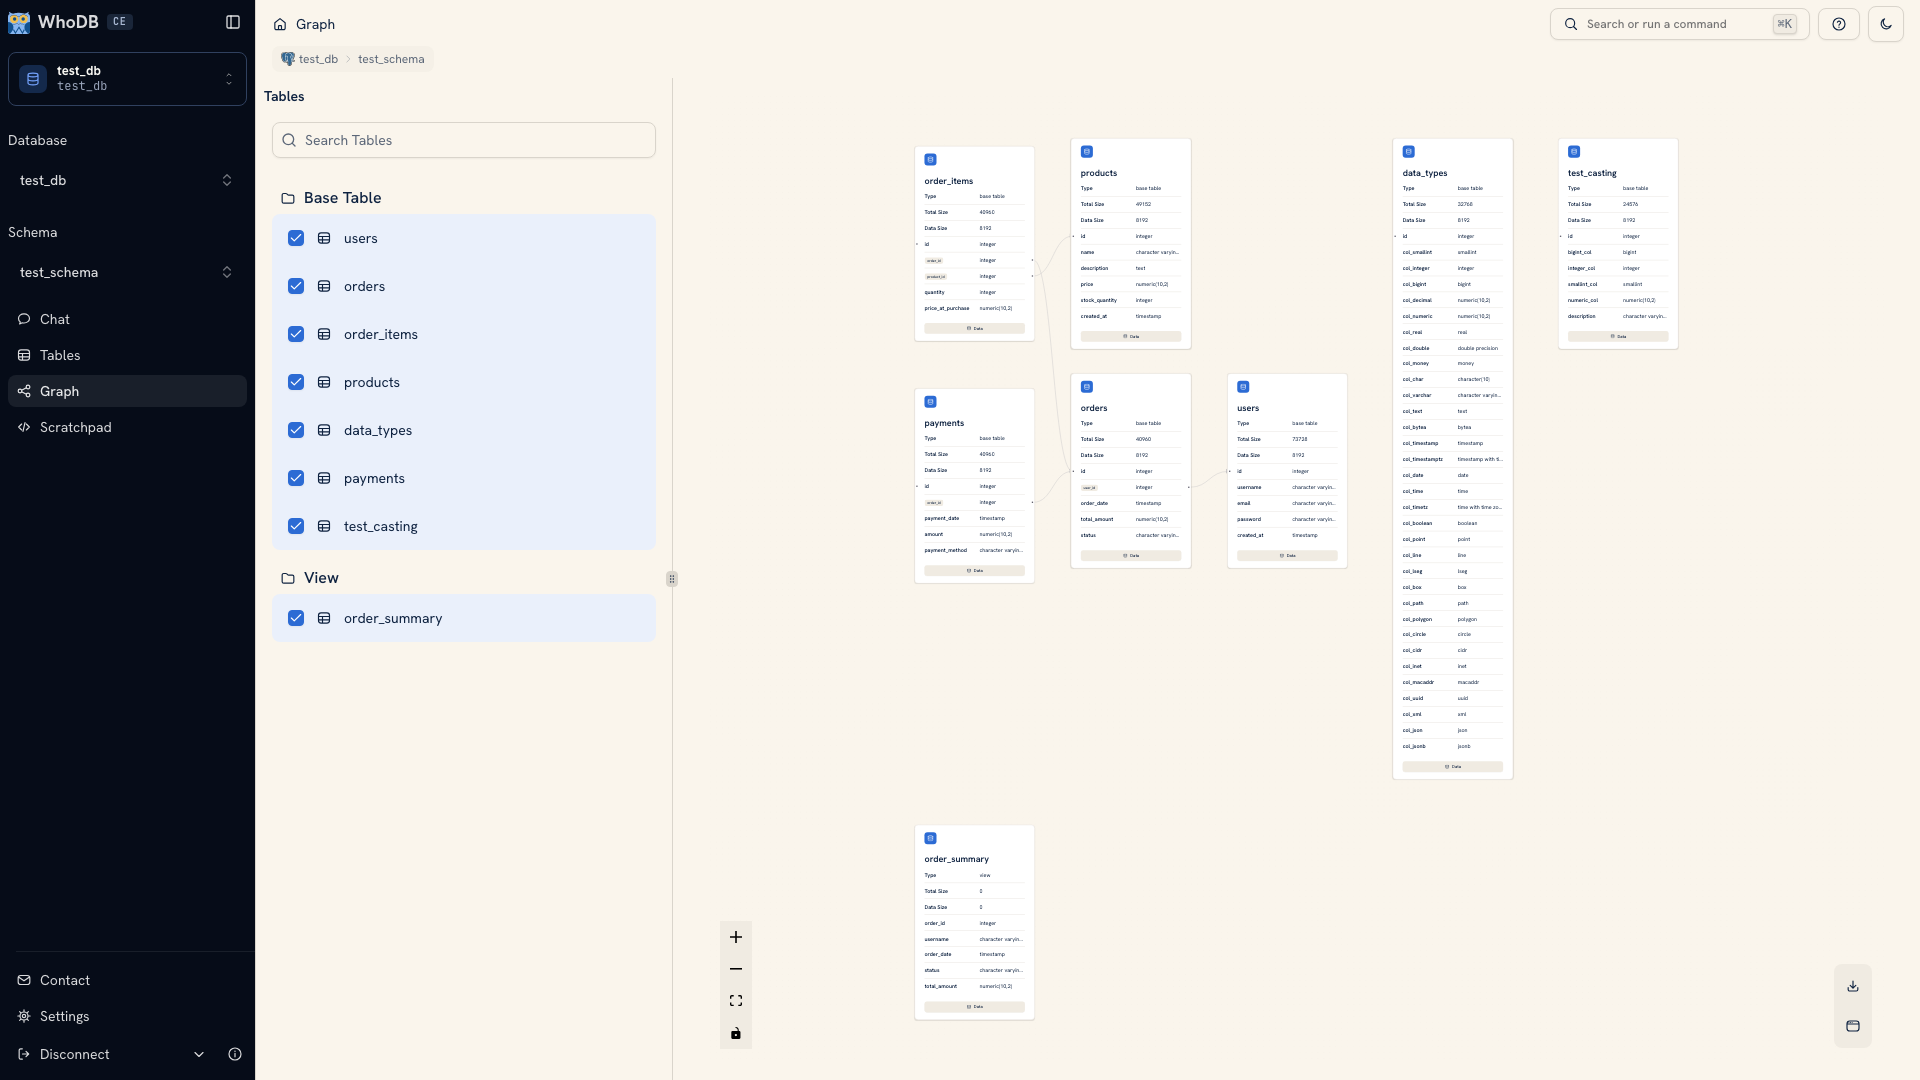 An object node with its Data action
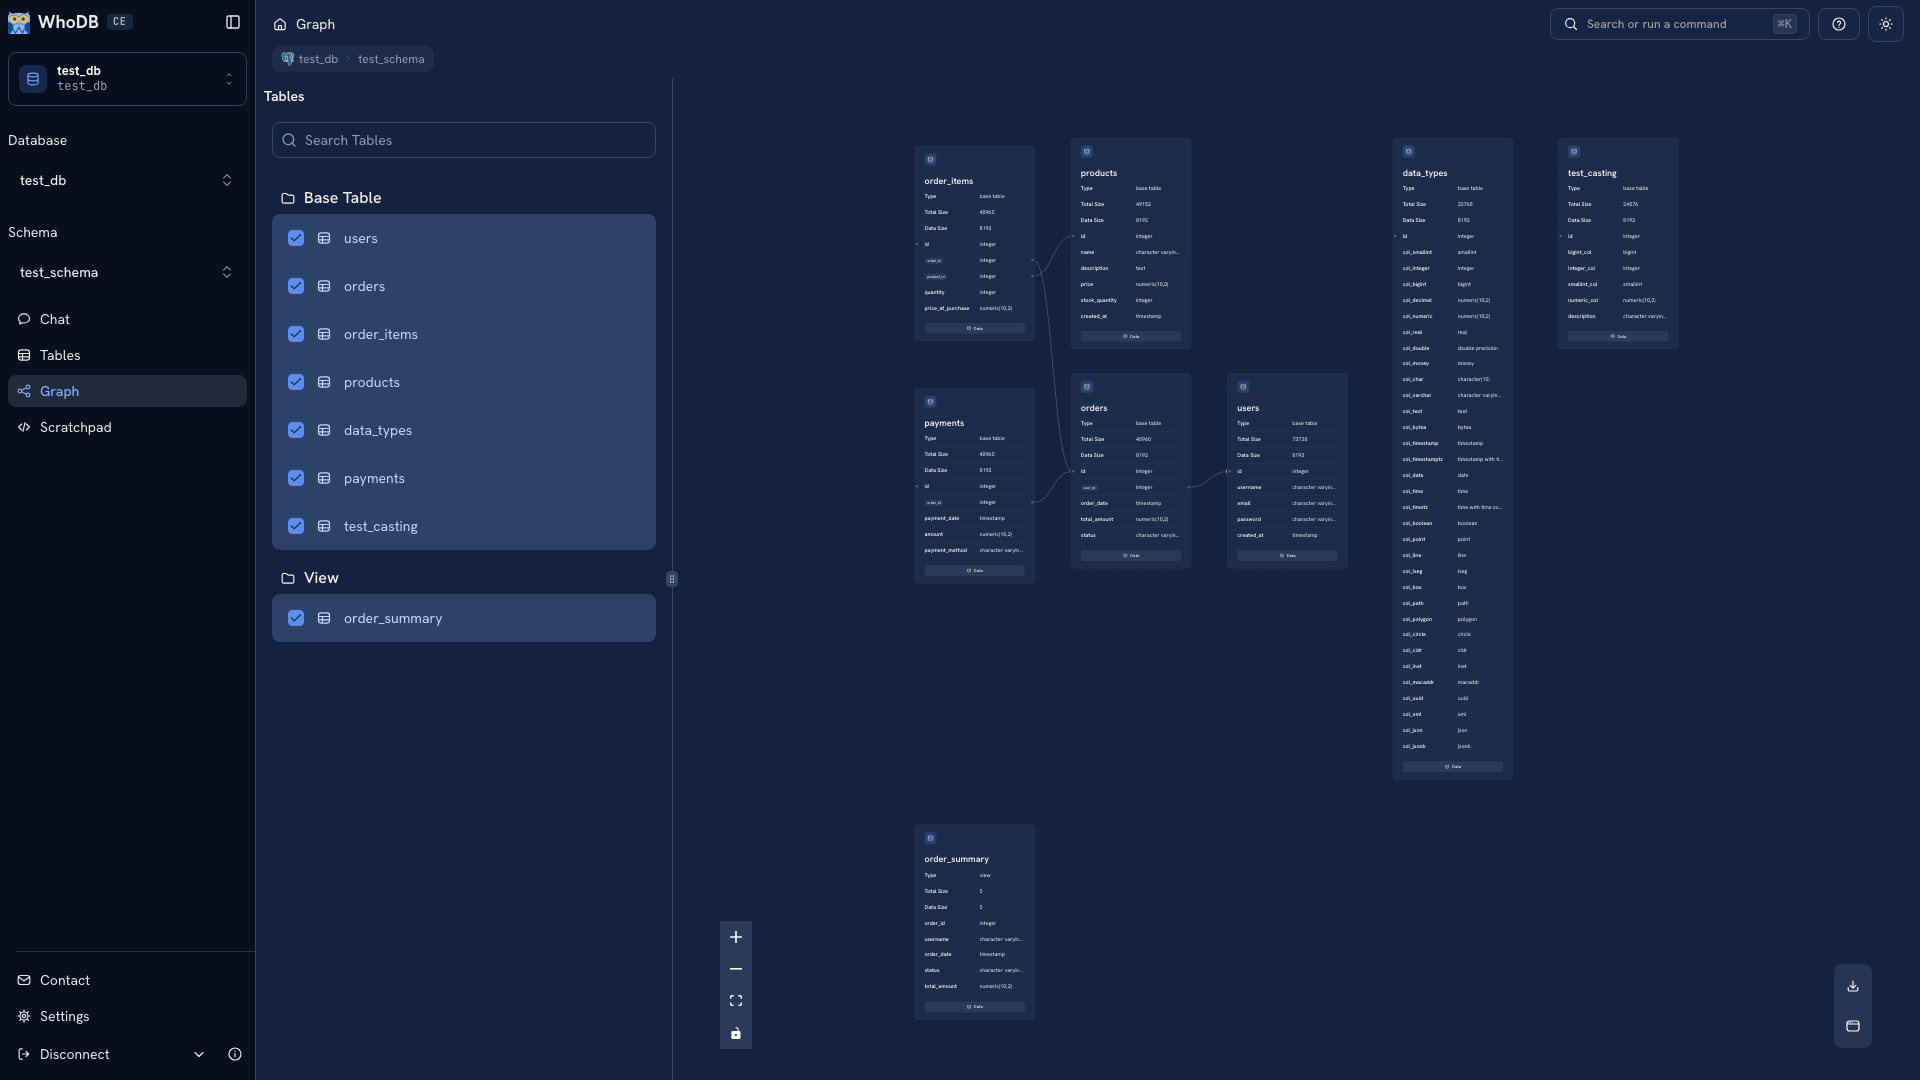 An object node with its Data action
A declared relationship helps identify a join key. It does not decide which records belong in a report. For example, an order-to-user relationship does not tell you whether to include cancelled orders in a count.
Move around#
Use the zoom and fit controls to bring the selected objects into view. The layout action rearranges the nodes, and the download action saves a diagram. The lock/pan control and holding Space help you move around the canvas.
If a connection you expect is missing, confirm that both objects are selected and inspect their metadata. Matching column names alone do not create an edge. See Relationships for the common causes.
Use the diagram in an investigation#
Once you have identified a likely relationship, verify it with a small query in Scratchpad. When sharing a downloaded diagram, record the source environment and date so readers know which schema it represents.
Tip
Use Ontology in WhoDB Platform when you need a shared model of business entities over connected data. Build on your schema knowledge.
Was this page helpful?